

Share on LinkedInShare on LinkedIn

ARTICLE · 02 FEBRUARY 2018

Advertising update: How to mislead consumers with graphs and statistics!

Comparative ads are often backed with statistics and graphs, so audiences trust them - but they can also easily mislead.

AustraliaMedia, Telecoms, IT, Entertainment

Ah yes comparative advertising. What better way to sell your own product than to trash the competition. So persuasive! So profitable! So much more risky than other ads.

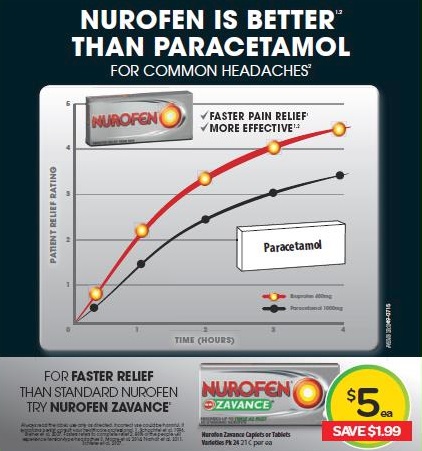
The latest example is this ad for Nurofen.

The graph is very effective. You can immediately see that Nurofen is both faster and more effective than Panadol and make your purchase choice accordingly. The thing is, the data was sourced from a single study in 1996. And there were more recent studies that concluded that ibuprofen was not in fact superior to paracetamol.

GSK, who sells Panadol, sued Reckitts, who sells Nurofen, saying the ads were misleading. The Federal Court agreed. Even though GSK represented the 1996 study accurately, the claims were misleading given the contradictory and more recent research findings.

We operate a free-to-view policy, asking only that you register in order to read all of our content. Please login or register to view the rest of this article.

See more popular content from