1. REGIONAL CLIMATE CHANGE EFFECTS
The following graphics will facilitate a general understanding
of the effects.
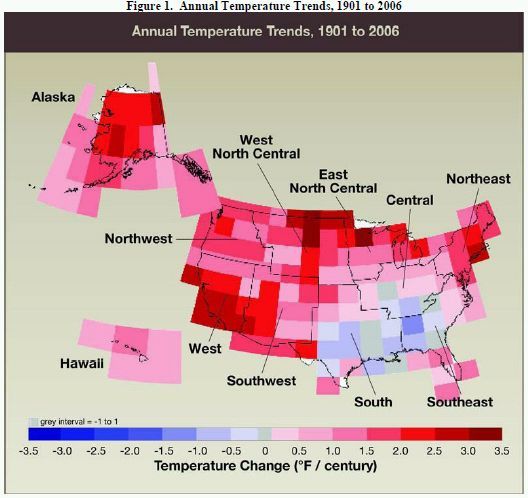
Figure IV.5. U.S. trends of annually averaged
temperature for the period 1901 to 2006 in °F per century. Data
are from the Historical Climate Data Network. Source:
NOAA/NCDC.1
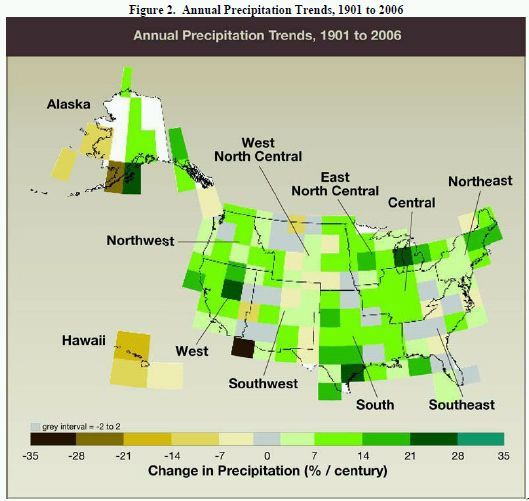
Data are from the Historical Climate Data Network. Source:
NOAA/NCDC (NOAA, n.d.).2
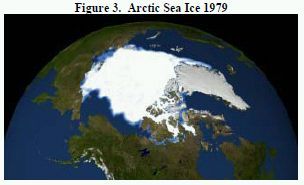

These two images, constructed from satellite data, compare
Arctic sea ice concentrations in September of 1979 and 2007.
Source: NASA, updated from ACIA (2004).3
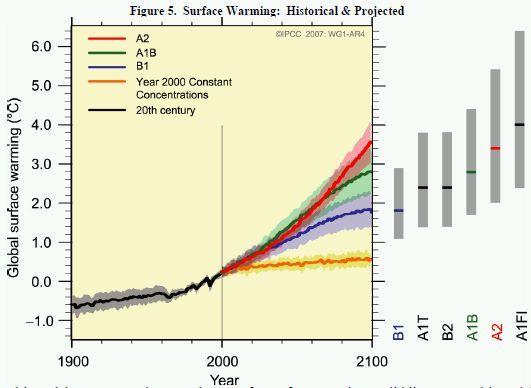
Multi-model averages and assessed ranges for surface warming.
Solid lines are multi-model global averages of surface warming
(relative to 1980 to 1999) for the scenarios A2, A1B, and B1, shown
as continuations of the 20th-century simulations. Shading denotes
the ±1 standard deviation range of individual model annual
averages. The orange line is for the experiment where
concentrations were held constant at year