Exhausted from navigating through an Excel model to discern the
credit card inflow breakdown for Q2? Advanced data
visualization tools like Tableau, Microsoft Power BI, and QlikView,
along with coding languages such as R and Python, can significantly
refine and elevate your financial analysis capabilities.
From flipping through Excel
tabs...
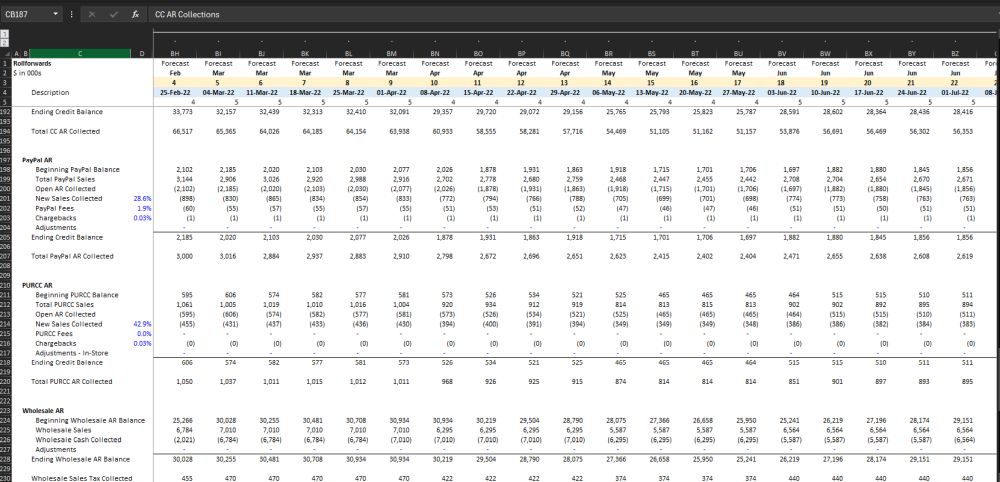
...to immediately identifying red flags and trends
in a dashboard...
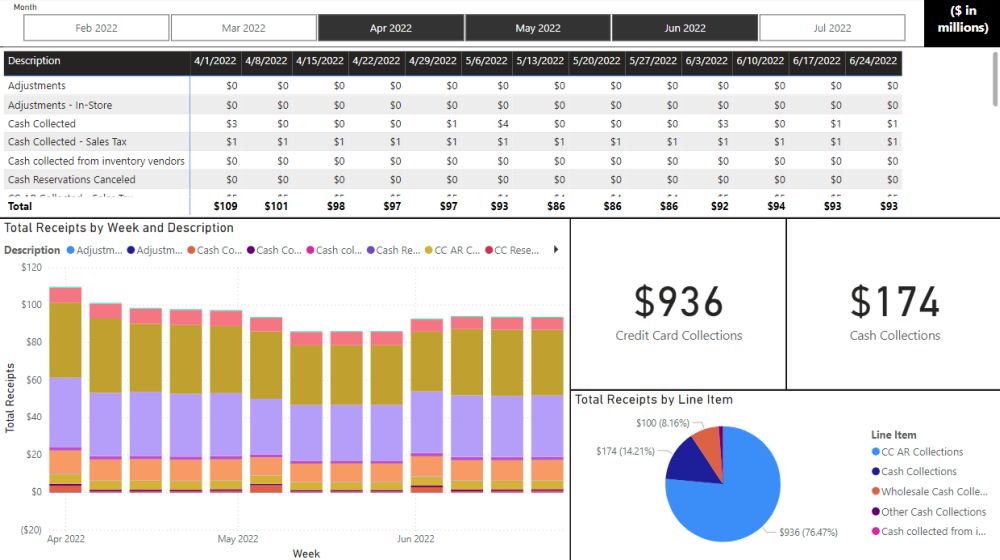
In the dynamic world of financial modeling and forecasting, the
balance between traditional tools and modern solutions is key to
achieving comprehensive and dynamic outcomes. Microsoft Excel and
other spreadsheet tools have long been the cornerstone of financial
analysis, offering robust capabilities for creating detailed
models. However, the addition of complementary data visualization
tools, such as Microsoft Power BI, has marked a significant
evolution in how we approach financial planning, particularly in
the realms of 13-week cash modeling