Two roads to the same destination
One of the most important questions I ask when planning client’s investment/retirement strategies is: What investment journey do you want to go on? This is so important, as it will dictate their emotional tolerance to their investments over time.
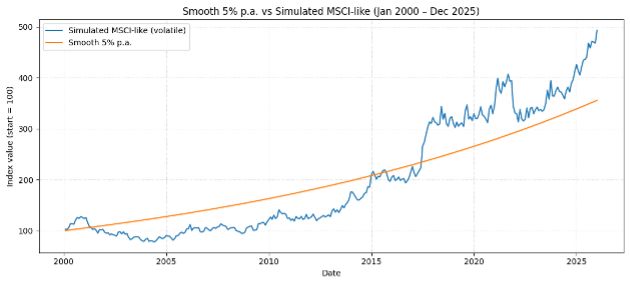
The chart above tells a remarkable story. Both paths start at 100 and end well above 350 — but the experience of getting there couldn’t be more different. Your life stage, not just your returns, should determine which road you take.
- Simulated MSCI (global stock market benchmark-like, volatile) — blue line
- Smooth 5% p.a. — orange line
Both lines begin at exactly the same place in January 2000 and travel across 25 years. The blue line — representing a globally diversified equity portfolio similar to the MSCI World Index — ends the period around 490. The orange line, a smooth 5% per annum return, ends near 350. On paper, the blue line wins handsomely.