Share on LinkedInShare on LinkedIn

ARTICLE · 07 FEBRUARY 2023

The Elephant Turns Into A Cheetah!

AZB & Partners
AZB & Partners
Contributor
AZB & Partners

AZB & Partners

AZB & Partners, one of India’s premier law firms was founded in 2004 with a clear purpose to...

View firm profile
Explore more from AZB & Partners

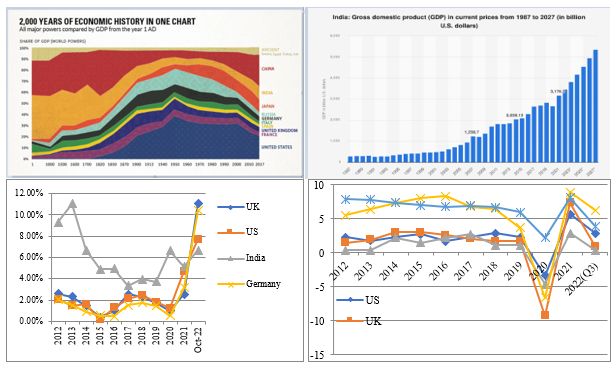
The first graph above shows that it took 60 years for India to reach its first trillion dollars of Gross Domestic Product.

IndiaStrategy

1279048a.jpg

The first graph above shows that it took 60 years (from 1947 to 2007) for India to reach its first trillion dollars of Gross Domestic Product (GDP). The next trillion took 8 years (2007 to 2015) and we were at the edge of achieving 3 trillion on the eve of Covid. As our leaders and experts having been telling us repeatedly, we should add one trillion every 3-4 years henceforth. Infact as the second graph shows us, for most of history (since the 1st AD to 1820), India and China dominated the world economy, so reverting to mean just requires us to play with a straight bat and not throw away our wicket and advantage.

Our third and fourth graphs show how favourable our macros are in comparison to the United States (US), China, Germany and the United Kingdom (UK). We are growing at double the pace of any other large economy and after a very long time, we have less inflation than the US, UK and Germany. Add to this the geopolitics, Ukraine war and climate transition

We operate a free-to-view policy, asking only that you register in order to read all of our content. Please login or register to view the rest of this article.

The content of this article is intended to provide a general guide to the subject matter. Specialist advice should be sought about your specific circumstances.

See more popular content from